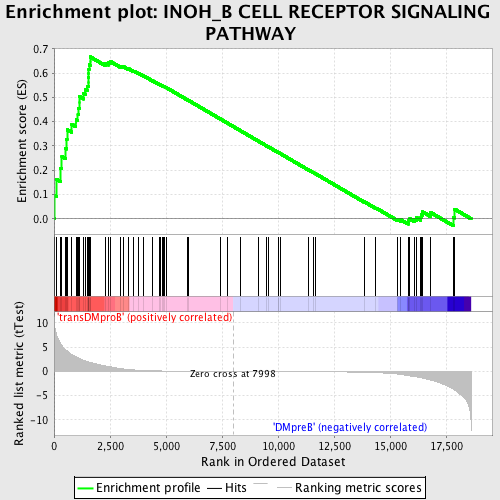
Profile of the Running ES Score & Positions of GeneSet Members on the Rank Ordered List
| Dataset | Set_04_transDMproB_versus_DMpreB.phenotype_transDMproB_versus_DMpreB.cls #transDMproB_versus_DMpreB.phenotype_transDMproB_versus_DMpreB.cls #transDMproB_versus_DMpreB_repos |
| Phenotype | phenotype_transDMproB_versus_DMpreB.cls#transDMproB_versus_DMpreB_repos |
| Upregulated in class | transDMproB |
| GeneSet | INOH_B CELL RECEPTOR SIGNALING PATHWAY |
| Enrichment Score (ES) | 0.6666582 |
| Normalized Enrichment Score (NES) | 1.616955 |
| Nominal p-value | 0.0021691974 |
| FDR q-value | 0.17667018 |
| FWER p-Value | 0.642 |
| PROBE | DESCRIPTION (from dataset) | GENE SYMBOL | GENE_TITLE | RANK IN GENE LIST | RANK METRIC SCORE | RUNNING ES | CORE ENRICHMENT | |
|---|---|---|---|---|---|---|---|---|
| 1 | GRB7 | 20673 | 14 | 10.160 | 0.0963 | Yes | ||
| 2 | LAT | 17643 | 116 | 7.434 | 0.1619 | Yes | ||
| 3 | GAB1 | 18828 | 276 | 5.806 | 0.2088 | Yes | ||
| 4 | VAV1 | 23173 | 347 | 5.300 | 0.2556 | Yes | ||
| 5 | SH2D2A | 6569 | 501 | 4.488 | 0.2903 | Yes | ||
| 6 | PRKCH | 21246 | 560 | 4.274 | 0.3280 | Yes | ||
| 7 | CD19 | 17640 | 580 | 4.195 | 0.3670 | Yes | ||
| 8 | LCK | 15746 | 786 | 3.491 | 0.3893 | Yes | ||
| 9 | ITPR1 | 17341 | 977 | 2.997 | 0.4077 | Yes | ||
| 10 | PRKCD | 21897 | 1065 | 2.795 | 0.4297 | Yes | ||
| 11 | CD79A | 18342 | 1082 | 2.743 | 0.4551 | Yes | ||
| 12 | DOK2 | 354 | 1136 | 2.652 | 0.4775 | Yes | ||
| 13 | TRAF6 | 5797 14940 | 1138 | 2.646 | 0.5028 | Yes | ||
| 14 | KRAS | 9247 | 1320 | 2.284 | 0.5148 | Yes | ||
| 15 | NFKBIE | 23225 1556 | 1402 | 2.139 | 0.5309 | Yes | ||
| 16 | SOS2 | 21049 | 1479 | 2.025 | 0.5461 | Yes | ||
| 17 | CRKL | 4560 | 1532 | 1.945 | 0.5619 | Yes | ||
| 18 | GRB2 | 20149 | 1534 | 1.943 | 0.5804 | Yes | ||
| 19 | ITPR3 | 9195 | 1545 | 1.926 | 0.5983 | Yes | ||
| 20 | PIK3CD | 9563 | 1550 | 1.916 | 0.6164 | Yes | ||
| 21 | TRAF4 | 10217 5796 1400 | 1563 | 1.906 | 0.6339 | Yes | ||
| 22 | NFKB1 | 15160 | 1611 | 1.847 | 0.6490 | Yes | ||
| 23 | RELA | 23783 | 1612 | 1.845 | 0.6667 | Yes | ||
| 24 | TRAF2 | 14657 | 2284 | 1.132 | 0.6413 | No | ||
| 25 | SH2B3 | 5001 16383 | 2440 | 1.001 | 0.6425 | No | ||
| 26 | MAPK3 | 6458 11170 | 2529 | 0.941 | 0.6468 | No | ||
| 27 | RAF1 | 17035 | 2978 | 0.564 | 0.6280 | No | ||
| 28 | MAP2K1 | 19082 | 3106 | 0.498 | 0.6259 | No | ||
| 29 | CD79B | 20185 1309 | 3326 | 0.388 | 0.6178 | No | ||
| 30 | ARAF | 24367 | 3557 | 0.298 | 0.6083 | No | ||
| 31 | TRAF1 | 14611 | 3763 | 0.240 | 0.5995 | No | ||
| 32 | NFKBIB | 17906 | 4009 | 0.178 | 0.5880 | No | ||
| 33 | GRB14 | 14574 2719 | 4412 | 0.117 | 0.5674 | No | ||
| 34 | SOS1 | 5476 | 4708 | 0.086 | 0.5524 | No | ||
| 35 | CRADD | 19640 | 4748 | 0.083 | 0.5510 | No | ||
| 36 | GAB2 | 1821 18184 2025 | 4834 | 0.077 | 0.5472 | No | ||
| 37 | CRK | 4559 1249 | 4878 | 0.075 | 0.5456 | No | ||
| 38 | PIK3R1 | 3170 | 4927 | 0.072 | 0.5437 | No | ||
| 39 | SHC3 | 21465 | 5010 | 0.068 | 0.5399 | No | ||
| 40 | GRAP2 | 5113 9398 | 5961 | 0.034 | 0.4890 | No | ||
| 41 | DOK1 | 17104 1018 1177 | 5992 | 0.033 | 0.4877 | No | ||
| 42 | IRS4 | 9183 4926 | 7411 | 0.008 | 0.4113 | No | ||
| 43 | PIK3CA | 9562 | 7760 | 0.003 | 0.3926 | No | ||
| 44 | PRKCI | 9576 | 8313 | -0.004 | 0.3629 | No | ||
| 45 | SHC1 | 9813 9812 5430 | 9137 | -0.016 | 0.3187 | No | ||
| 46 | FRS3 | 23209 | 9497 | -0.021 | 0.2995 | No | ||
| 47 | FYN | 3375 3395 20052 | 9588 | -0.022 | 0.2949 | No | ||
| 48 | PRKCE | 9575 | 10004 | -0.029 | 0.2728 | No | ||
| 49 | IRS1 | 4925 | 10031 | -0.029 | 0.2717 | No | ||
| 50 | PRKCQ | 2873 2831 | 10099 | -0.030 | 0.2683 | No | ||
| 51 | SRC | 5507 | 11343 | -0.054 | 0.2018 | No | ||
| 52 | GRB10 | 4799 | 11590 | -0.060 | 0.1891 | No | ||
| 53 | PRKCA | 20174 | 11681 | -0.062 | 0.1849 | No | ||
| 54 | CBL | 19154 | 13840 | -0.189 | 0.0704 | No | ||
| 55 | LCP2 | 4988 9268 | 14367 | -0.258 | 0.0445 | No | ||
| 56 | PRKCZ | 5260 | 15328 | -0.546 | -0.0021 | No | ||
| 57 | SYK | 21636 | 15479 | -0.643 | -0.0040 | No | ||
| 58 | MAP2K2 | 19933 | 15807 | -0.865 | -0.0134 | No | ||
| 59 | MYD88 | 18970 | 15820 | -0.874 | -0.0057 | No | ||
| 60 | TRAF3 | 21147 | 15882 | -0.921 | -0.0002 | No | ||
| 61 | PIK3R2 | 18850 | 16083 | -1.041 | -0.0010 | No | ||
| 62 | BLNK | 23681 3691 | 16184 | -1.124 | 0.0043 | No | ||
| 63 | BCAR1 | 18741 | 16371 | -1.292 | 0.0066 | No | ||
| 64 | NFKBIA | 21065 | 16384 | -1.316 | 0.0186 | No | ||
| 65 | NRAS | 5191 | 16449 | -1.395 | 0.0284 | No | ||
| 66 | HRAS | 4868 | 16802 | -1.753 | 0.0262 | No | ||
| 67 | FADD | 17536 8950 4711 | 17838 | -3.671 | 0.0055 | No | ||
| 68 | TRAF5 | 13718 | 17884 | -3.811 | 0.0395 | No |

